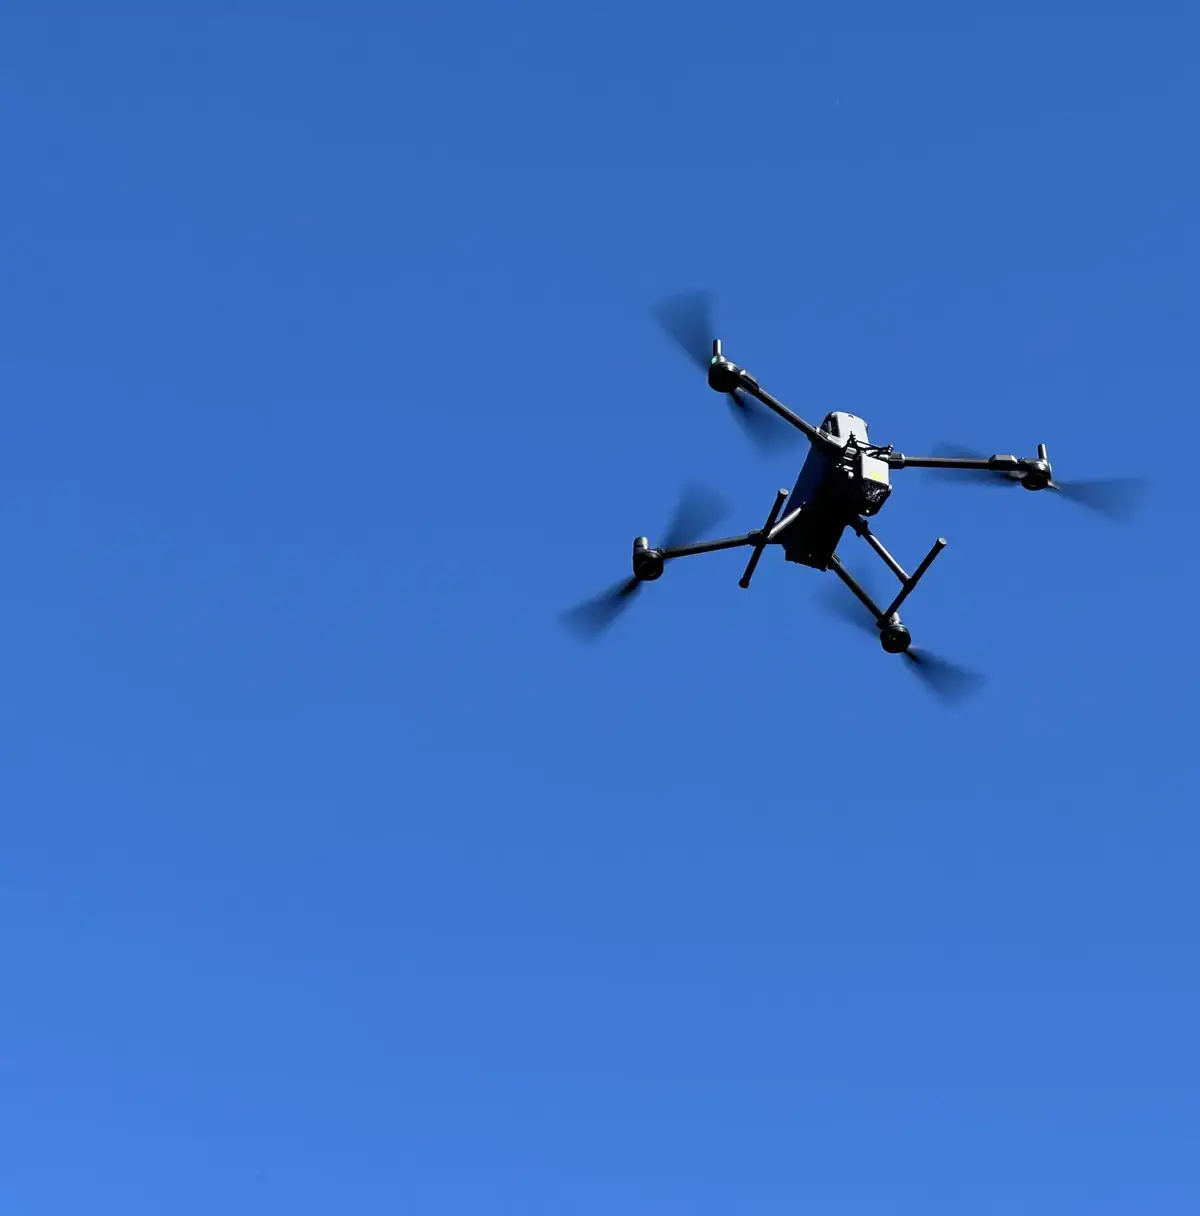
Drone LiDAR topographical & forest surveys, Ireland
We fly and process our own LiDAR, and have flown drone surveys since 2016. Photography shows what the canopy and ground look like, LiDAR captures their shape and elevation, and multispectral imagery shows plant health — and because we are foresters, we cross-check all three against the crop on the ground.
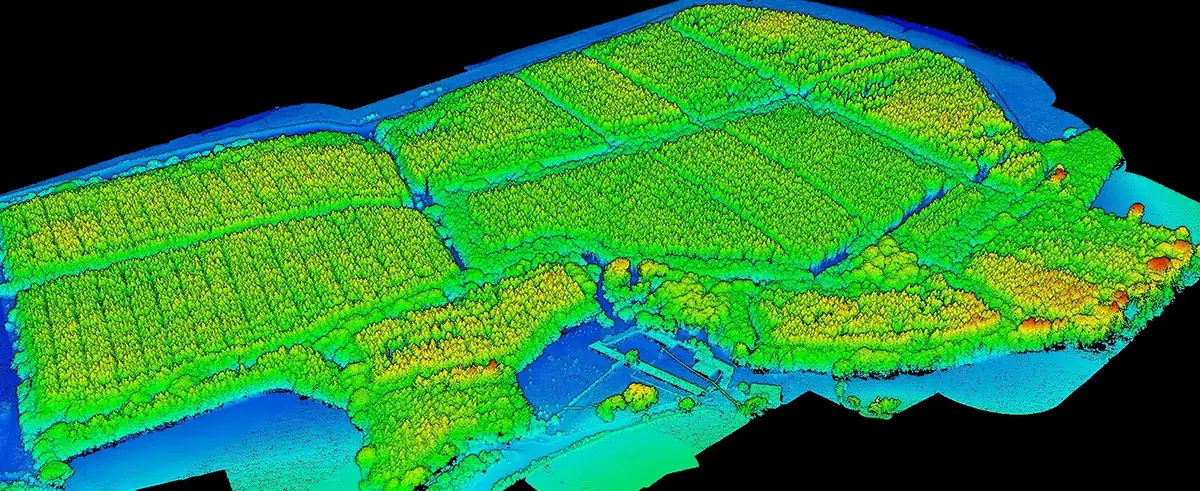
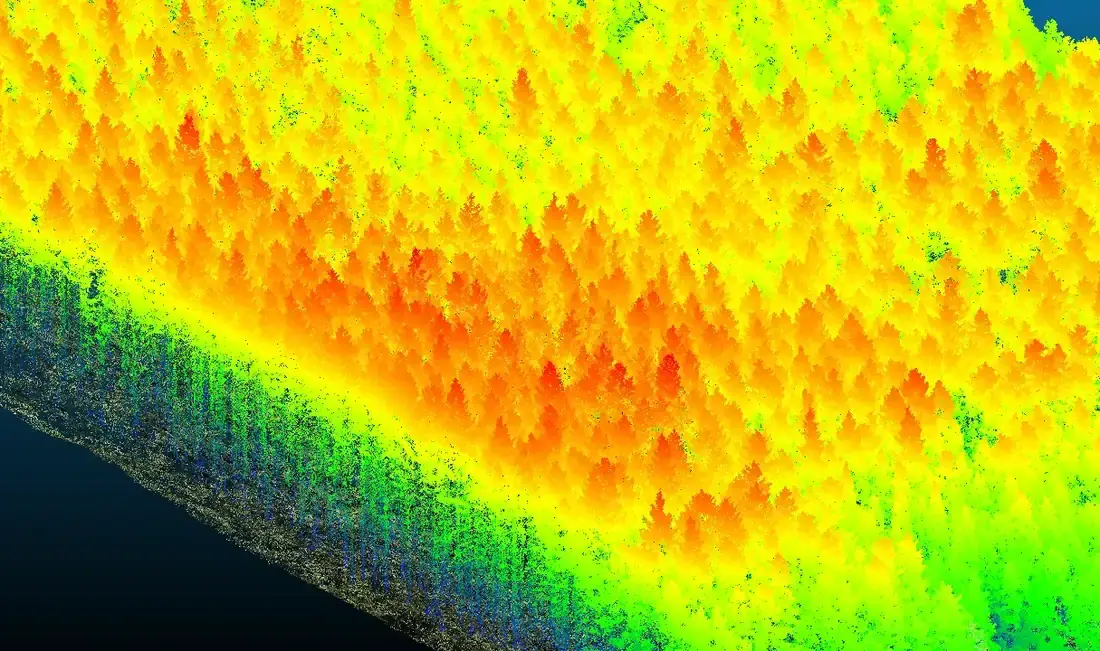
Every return from an estuary-side forest, coloured by height — the raw material for canopy models, tree detection, terrain and flood simulation.
One survey, six ways to see the forest.
Orthophotography
True-colour mosaics at 1.5–3 cm per pixel from 45 MP and multispectral cameras — for orientation, briefing contractors and inspecting individual trees and rows.
Canopy height, trees & stocking
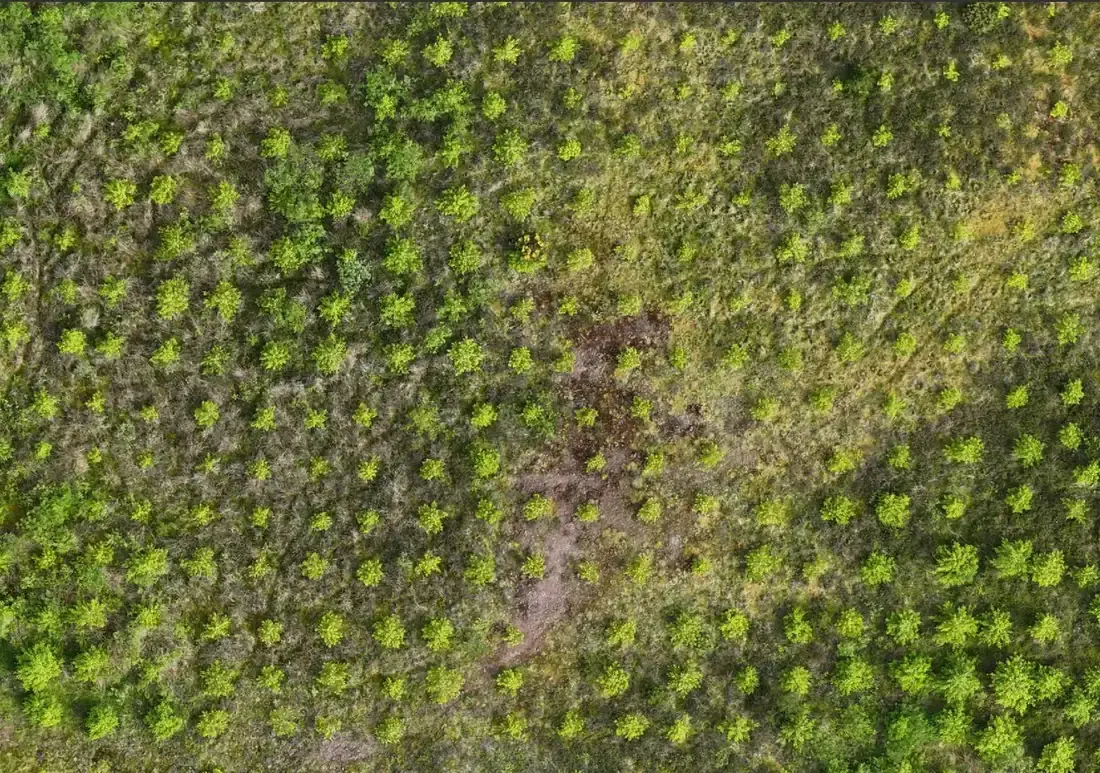
Every tree crown detected from the point cloud, with top heights and a 25 m stocking grid summarised by subcompartment — inventory-grade data for yield class and growth checks.
Canopy gaps & windblow
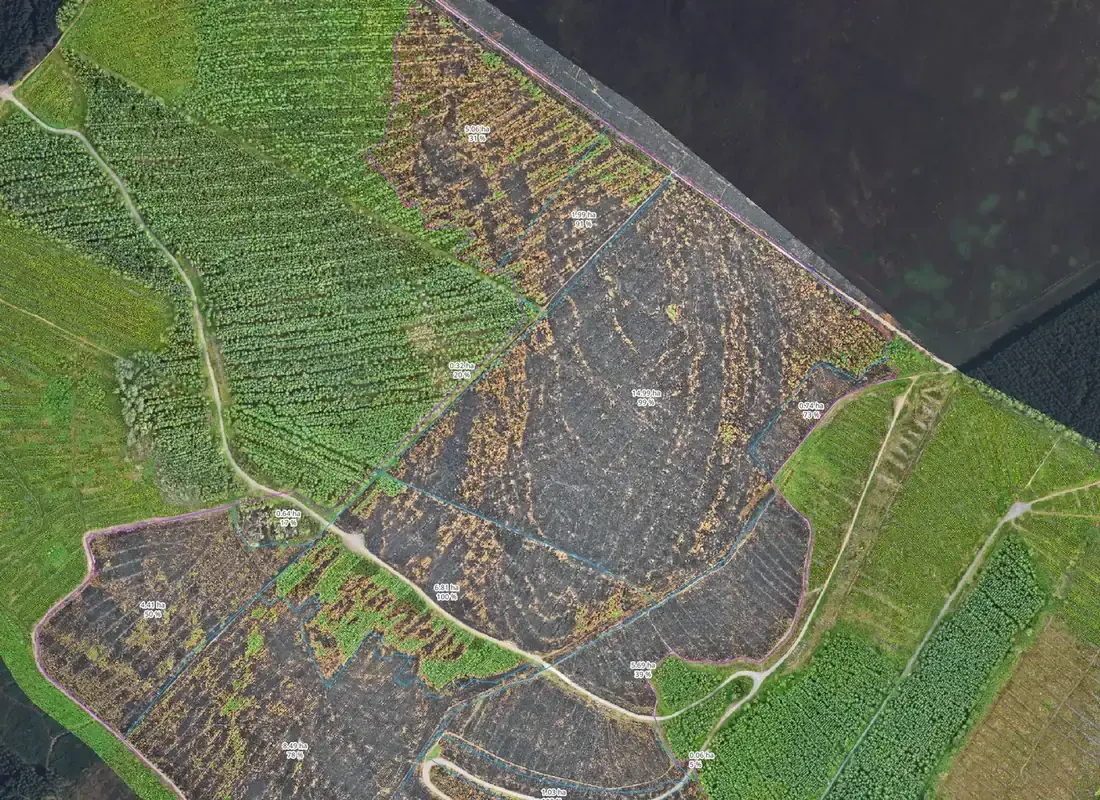
Unproductive area mapped and measured, so productive area, gaps and windblow are known before anyone walks the site.
Tree health & productivity
Multispectral indices classify the crop as healthy, not healthy or dead — by grid cell or tree by tree — and map productivity across it.
Terrain, drainage & contours
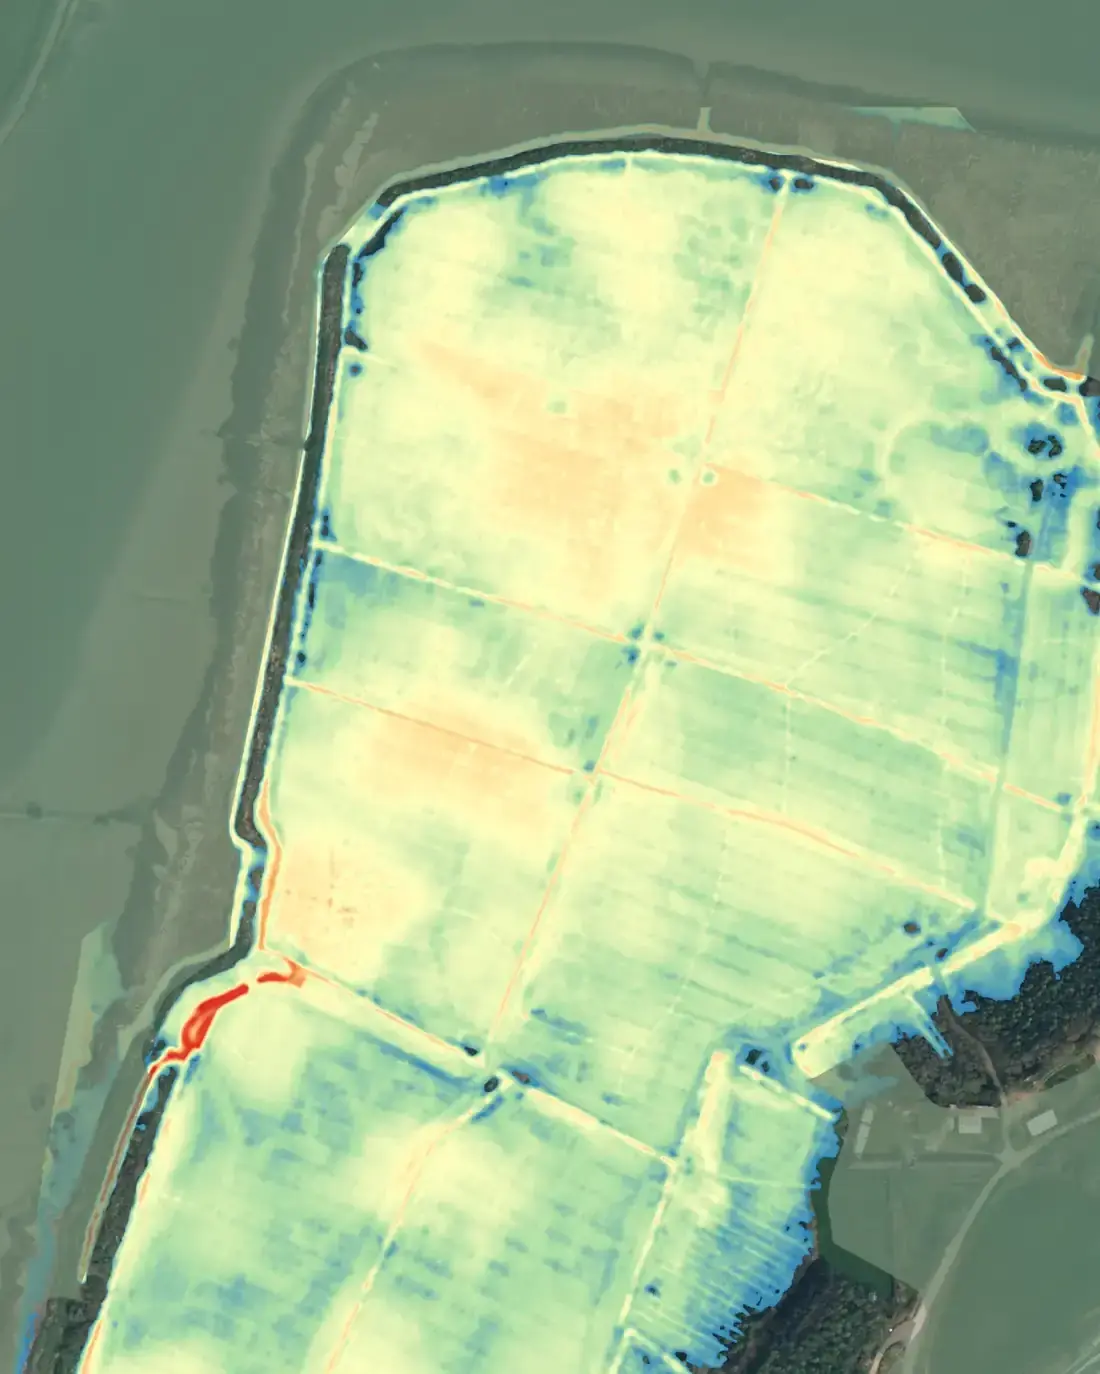
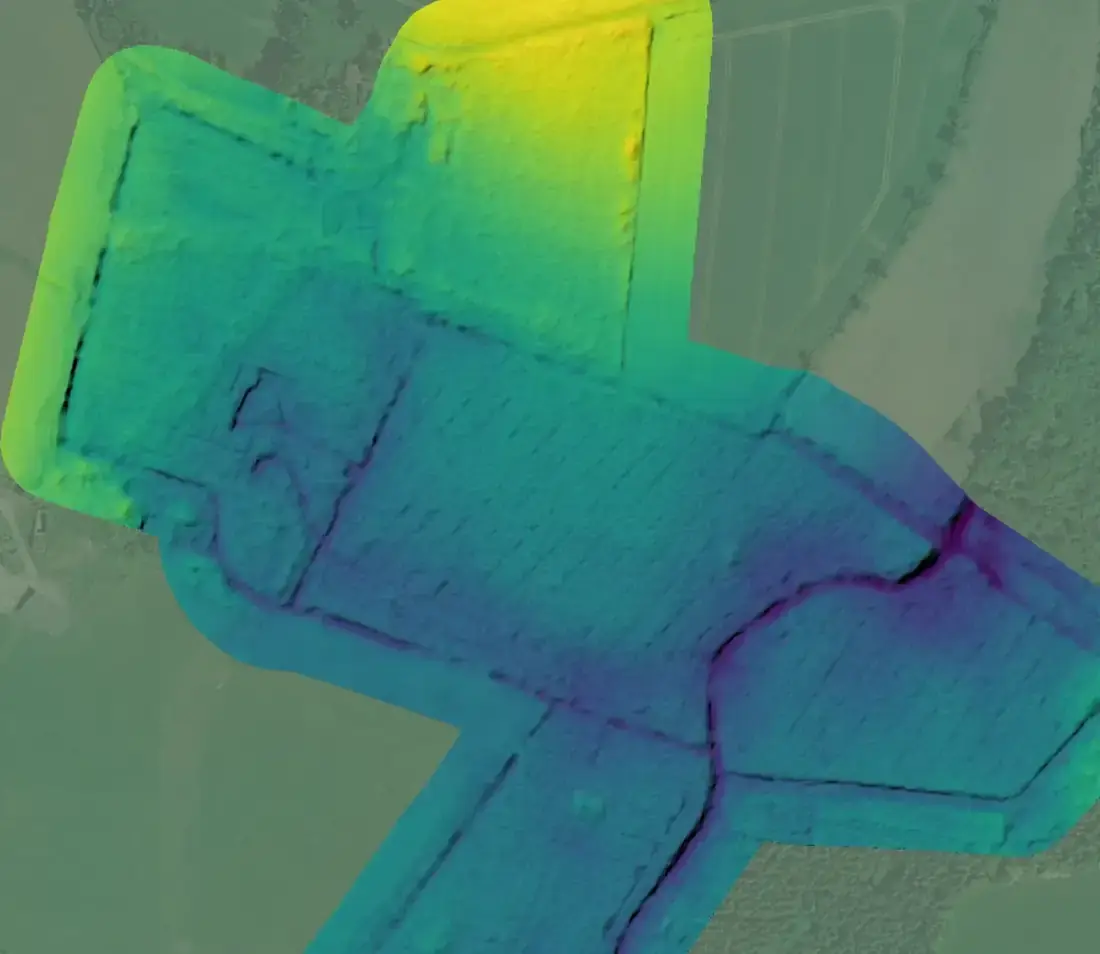
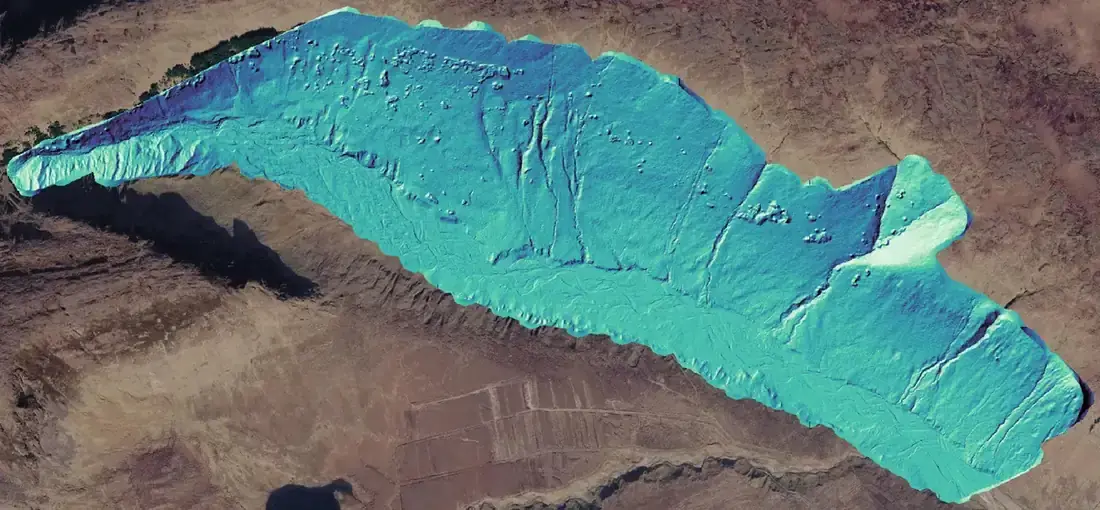
Bare-earth terrain and surface models, hillshade that reveals drains, old boundaries, crossings and tracks, and contours in Shapefile and DWG for operations and road design.
Flood simulation & 3D views
Modelled water depth for a breach or overtopping scenario, plus 3D views and cross-sections that anyone can read.
Survey-grade terrain data for wind, solar and infrastructure design.
When a site is being designed rather than managed, the survey has to stand up as a topographical survey: controlled, checked and reported. FMI’s LiDAR surveys are delivered to that standard.
Control and checkpoints
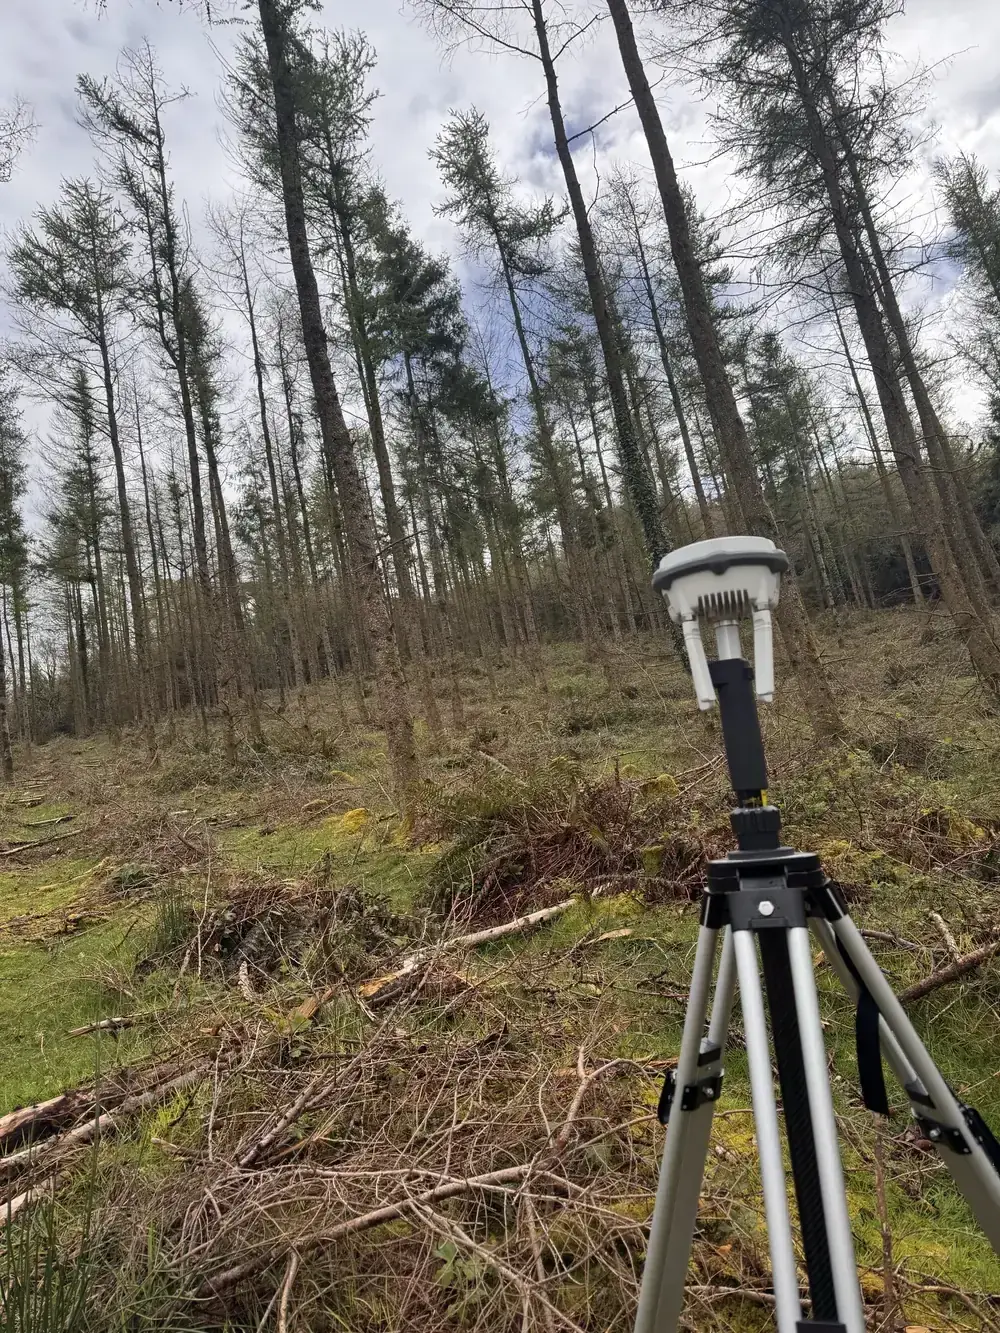
Ground control points on open ground and forest roads, measured twice by survey-grade GNSS — network RTK, or our own base station where there is no mobile coverage. At least 20% of points are withheld as independent checkpoints and never used in processing.
Coordinate system
Irish Transverse Mercator (ITM, EPSG:2157) and heights to Malin Head Ordnance Datum via the OSGM15 geoid — the systems Irish engineering drawings use.
Accuracy you can audit
Achieved horizontal and vertical accuracy is tested against the withheld checkpoints and reported at 95% confidence, separately for hard detail, open ground and forested ground, with RMSE and mean error stated. Achieved density is reported from the processing quality reports for open ground and beneath canopy, and any systematic shortfall is re-flown within the survey window.
Through the canopy
Up to five returns per pulse at 70–100 m above ground with terrain following; ground classification tuned for conifer forest and audited against profiles. On our most recent large mountain survey the point cloud averaged over 400 points per square metre, with more than 270 classified ground points per square metre beneath mature spruce — the ground is there to be modelled.
Deliverables for engineers
Raw and classified point clouds (LAS 1.4 / LAZ, tiled, with metadata); DTM and DSM GeoTIFFs at 0.25 m or finer; canopy height model; orthoimagery at 1.3–5 cm; contours at 0.5 m and 1 m in Shapefile and AutoCAD DWG; a control schedule with residuals and checkpoint results; and a survey report covering method, equipment, flight parameters, processing, achieved density and accuracy.
From the same flight
Canopy height, tree detection and stocking, canopy gaps and windblow, hillshade for drains, tracks and old boundaries, flow and ponding analysis from the terrain model, and GIS analysis and cartography — the forestry answers every development on forested land needs next, at the reduced cost of processing data already captured.
What the maps actually look like.
Surveys flown 2025–2026 · client sites shown without names, except where the owner has agreed
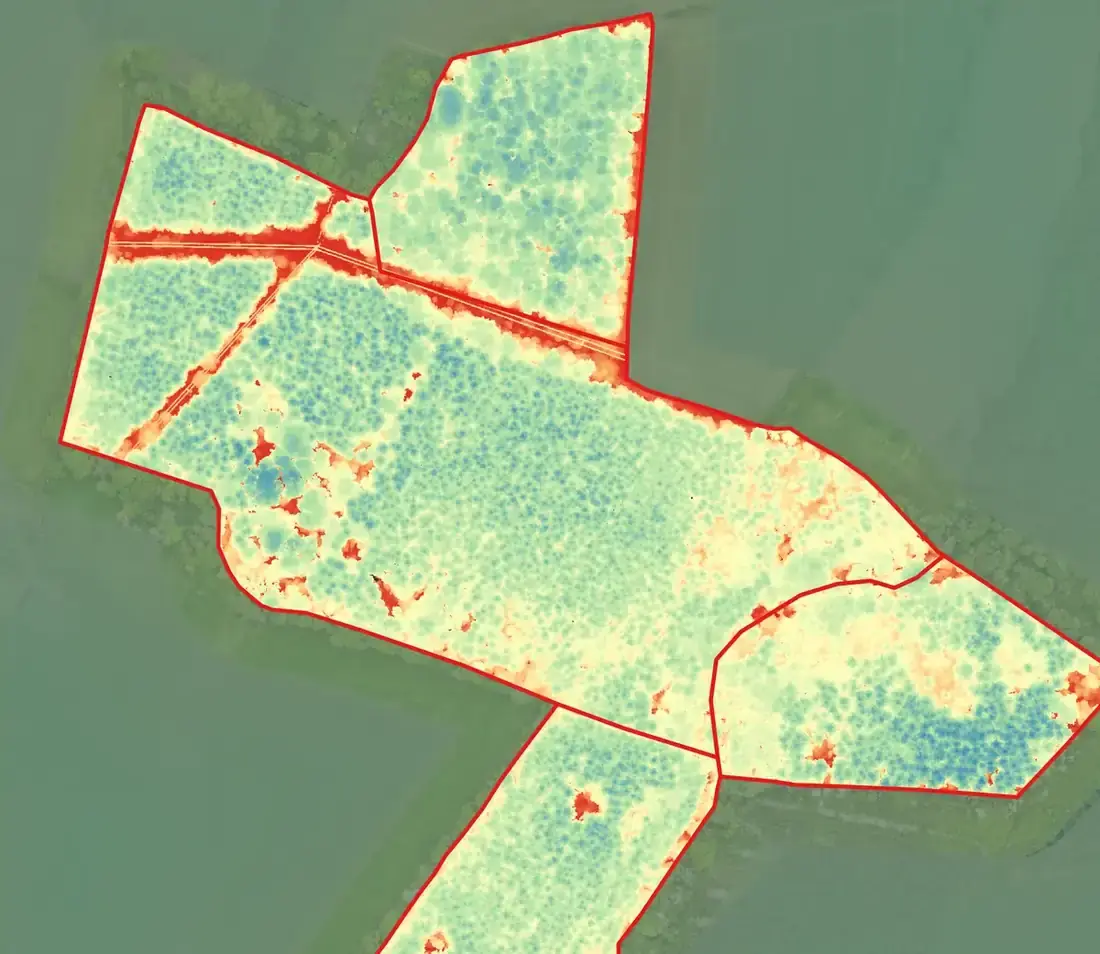

Phytophthora in larch, mapped stand by stand.
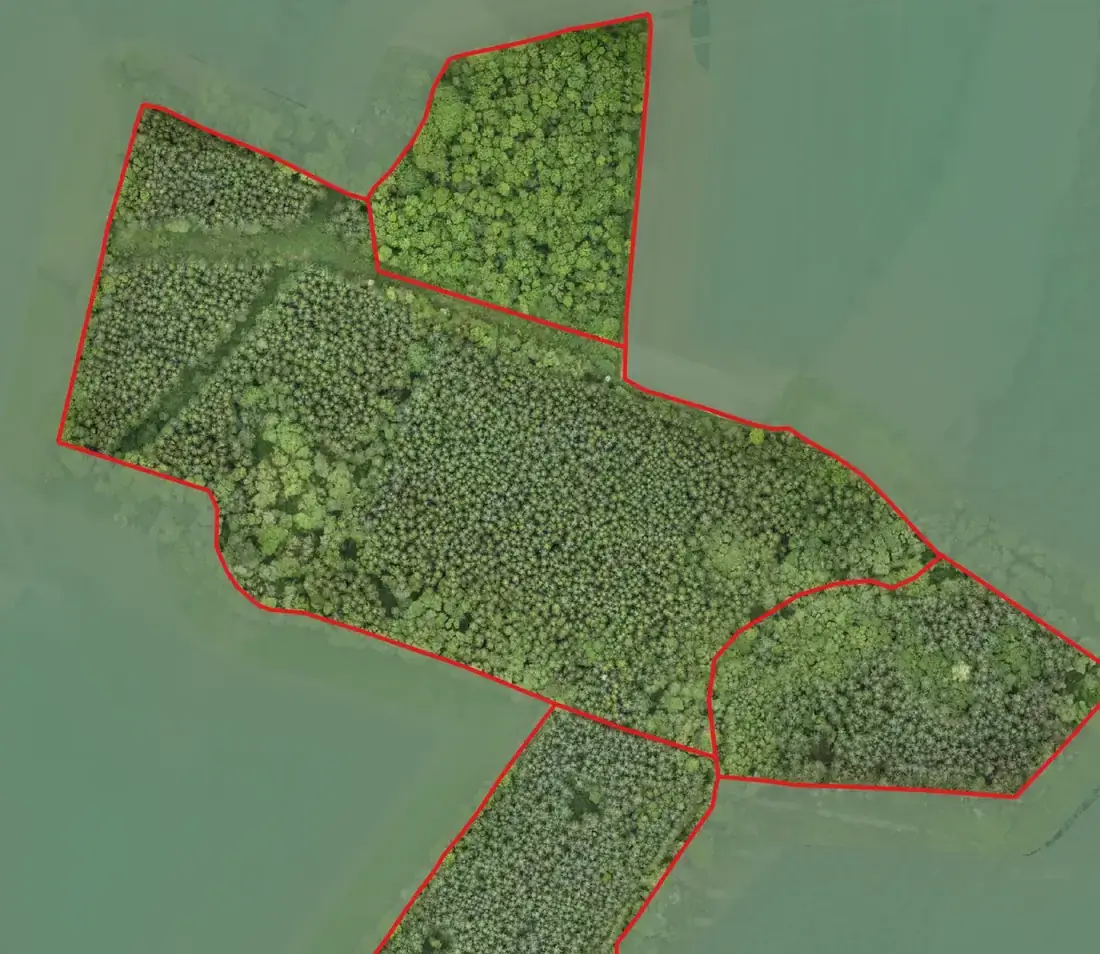
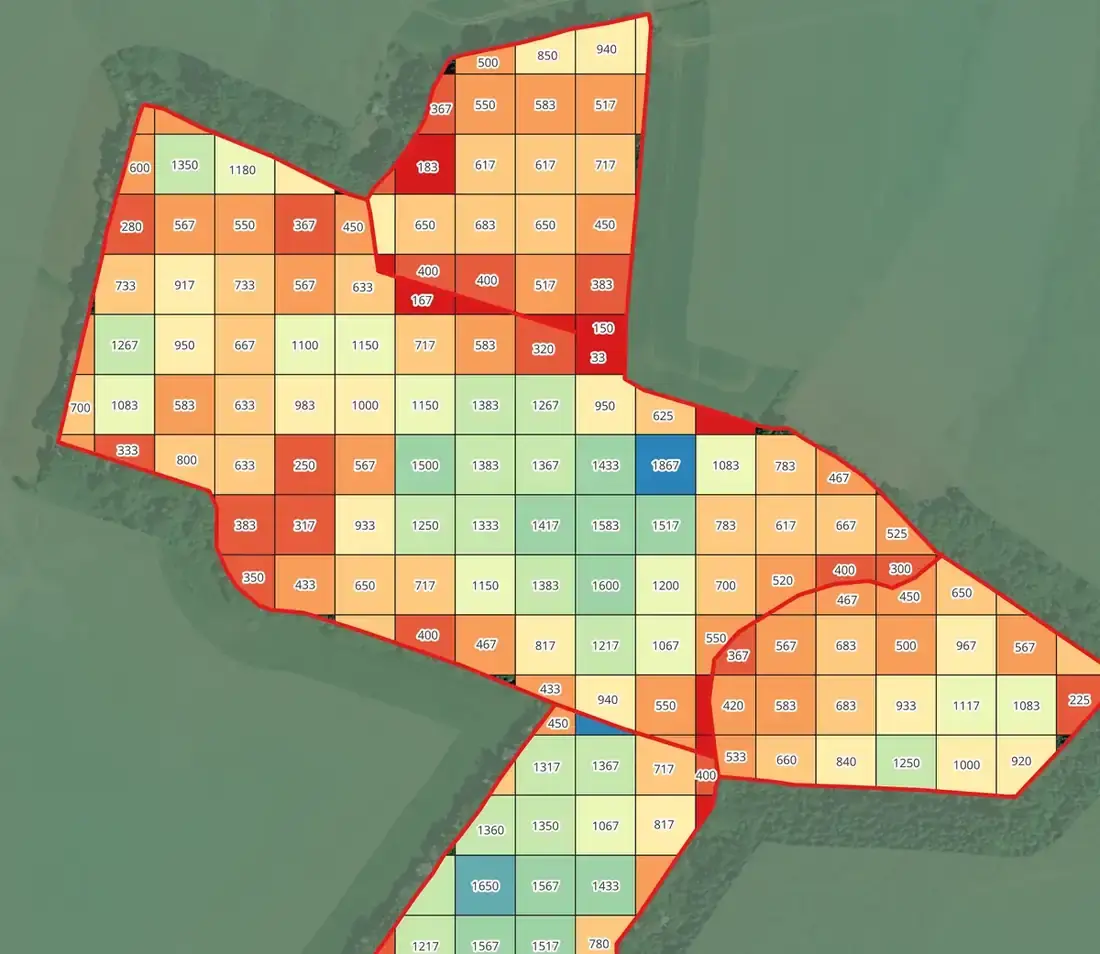
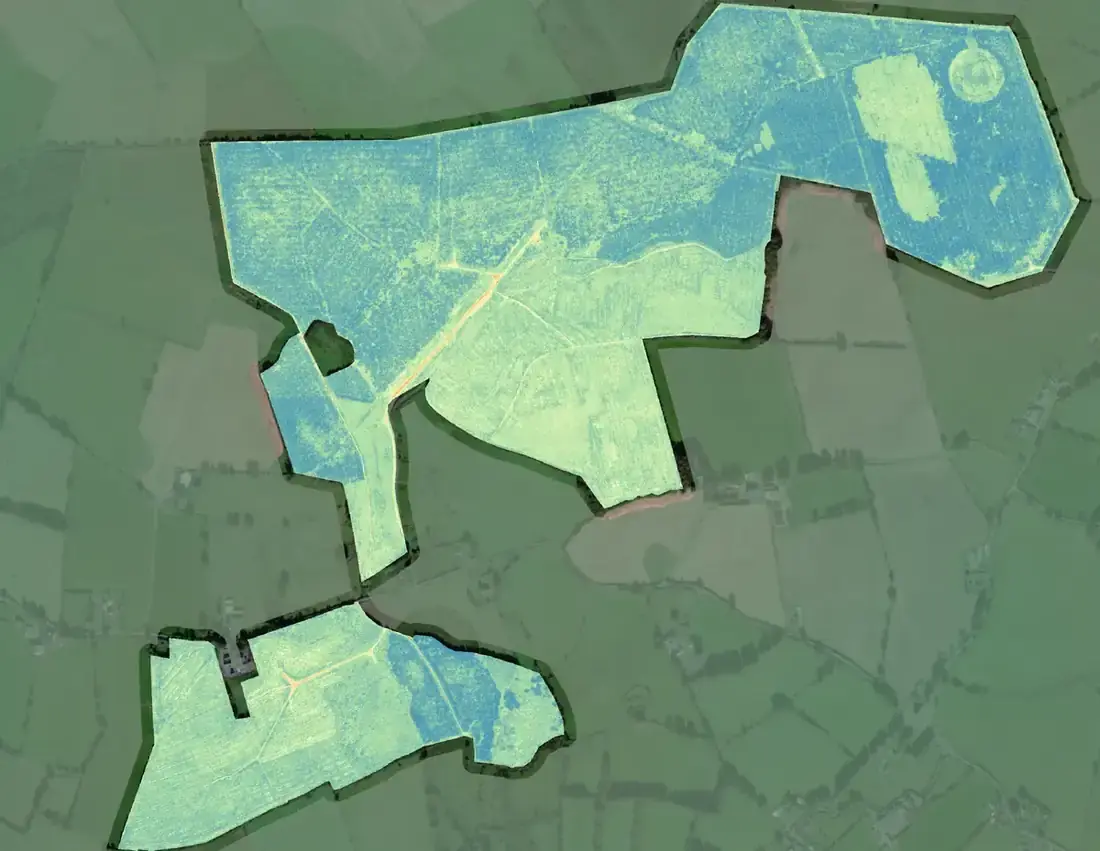
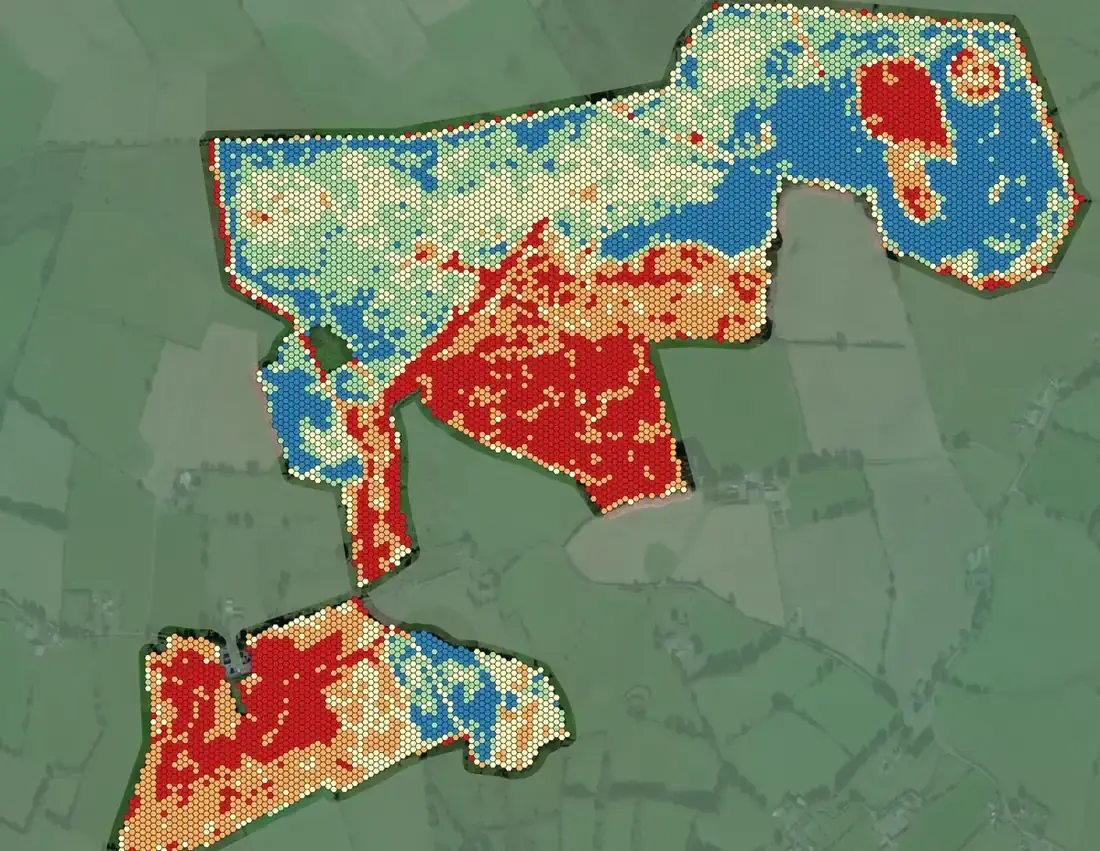
In June and July 2026 FMI flew nine larch properties with the multispectral drone to survey for Phytophthora. Every property comes back as three map sheets and a results table. Below, one stand’s three sheets — and a crown-by-crown detail from another.
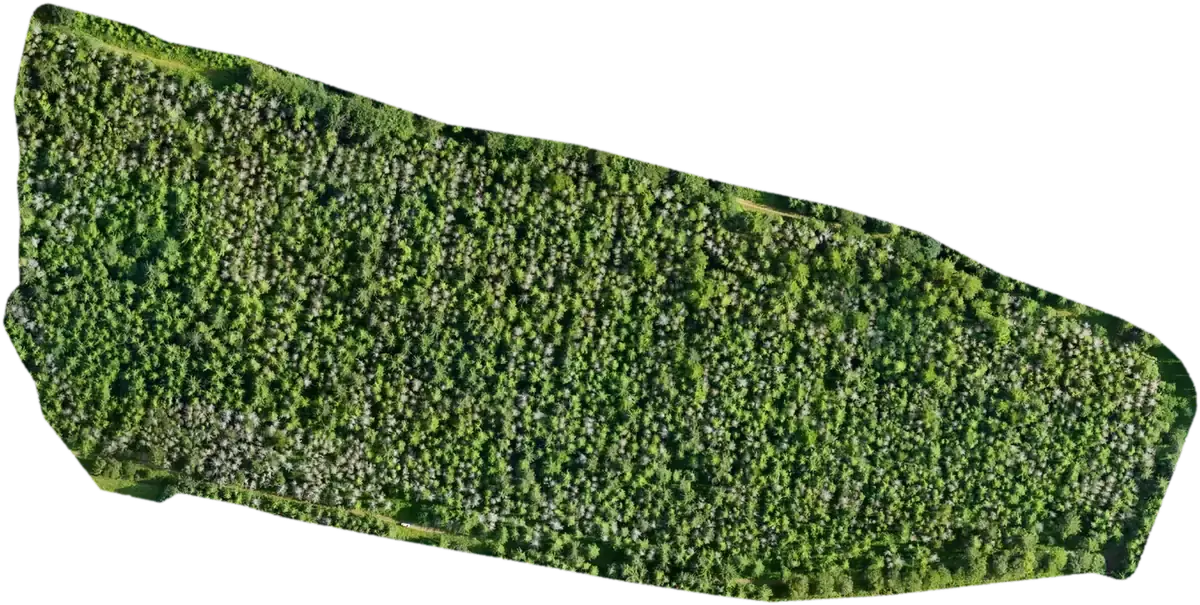
True colour from the multispectral drone’s 20 MP camera — the grey crowns are visible before any analysis.
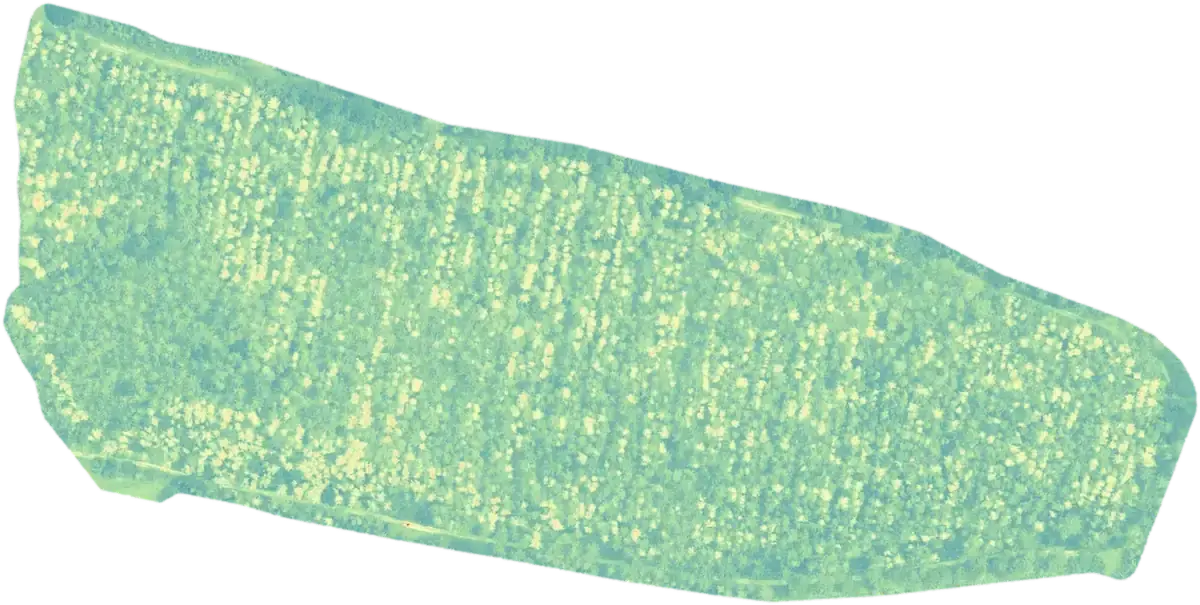
Green Normalised Difference Vegetation Index — a measure of chlorophyll rather than colour.
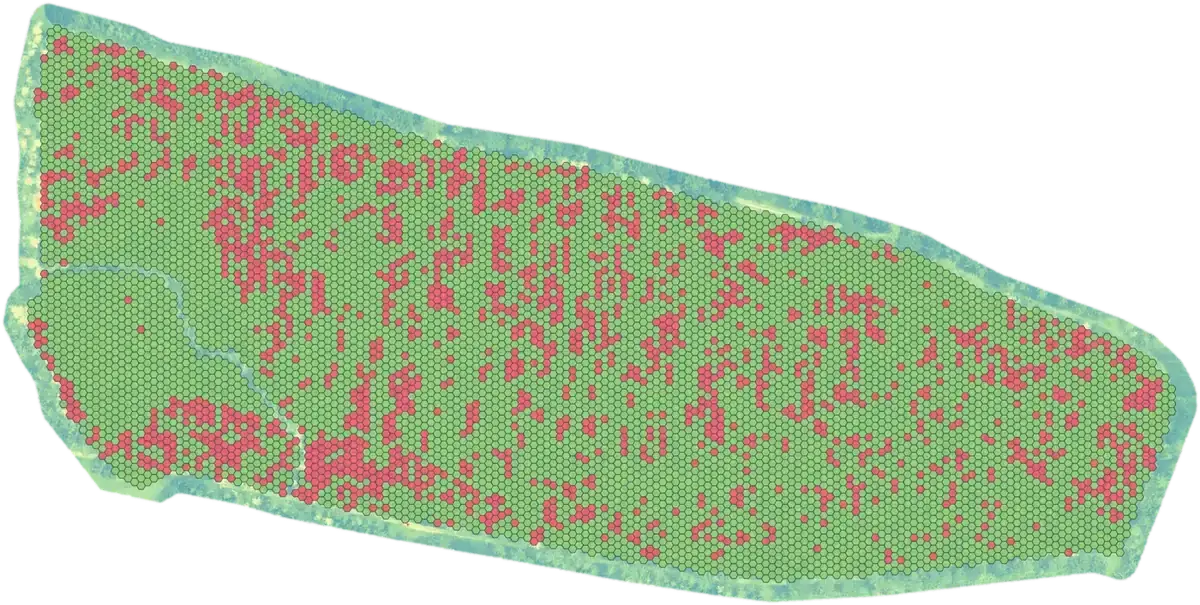
Every cell of the larch classified healthy or not healthy, and summed up by subcompartment.
Crown by crown.
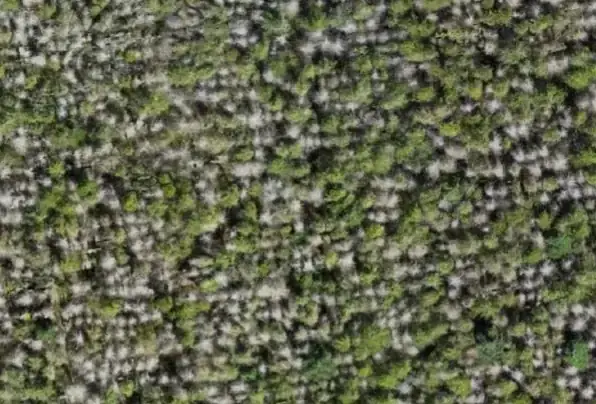
On some properties the assessment is made crown by crown. Left, the orthomosaic; right, the same canopy, about 100 m across, with the crowns classified in FMI’s AI-assisted tree health assessment — white for dead, red for not healthy, green for healthy.

What the manager gets.
Three A2 sheets per property in Irish Transverse Mercator — orthomosaic, GNDVI and tree health assessment — and a table for every subcompartment: area, the area or number of trees in each class, and the percentages. The table for the three-sheet stand:
| Subcomp. | Area ha | Healthy ha | Not healthy ha | Healthy % | Not healthy % |
|---|---|---|---|---|---|
| 1 | 10.6 | 8.16 | 2.44 | 77 | 23 |
| 2 | 1.16 | 0.93 | 0.23 | 80 | 20 |
Compartment codes removed. Sheets at 1:1,000 to 1:4,000 depending on the property.
Yours to keep, in the formats your GIS expects.
Every survey comes with the rendered maps and the processed datasets behind them — projected in Irish Transverse Mercator (EPSG:2157) with heights to Malin Head datum (OSGM15), and ready for ArcGIS, QGIS or CAD. The raw LiDAR can be normalised, merged, split, reprojected or resampled as you need.
- Orthophotography — 45 MP and multispectral
- Digital elevation model and hillshade
- Canopy height model and canopy gaps
- Individual tree detection — top heights & stocking
- Multispectral indices — NDVI, GNDVI, NDRE, OSAVI, LCI — and per-tree health assessment
- 25 m stocking grid and productivity maps
- Flood simulation; fire and windblow damage classification
- Raw and classified point clouds — LAS 1.4 / LAZ, tiled, in ITM and Malin Head, with metadata
- Digital terrain and surface models — GeoTIFF at 0.25 m, or 5 cm where the job needs it
- Canopy height model — GeoTIFF at 0.25–0.5 m
- Orthomosaic and index GeoTIFFs at 1.3–5 cm per pixel
- Contours at 0.5 m and 1 m — ESRI Shapefile and AutoCAD DWG; individual-tree and canopy-gap shapefiles
- Survey control schedule (Excel and PDF) and a survey report — method, equipment, flight parameters, processing, achieved density and accuracy
- Fly-through video on request
Two survey aircraft, one for every job.
FMI is a registered drone operator with the Irish Aviation Authority (Operator ID IAA-2021-28153) with three IAA-registered pilots. Every task starts with a documented risk assessment — airspace, geographical zones, NOTAMs, terrain, weather and people on the ground — and is flown under an operations manual overseen by a serving airline captain and UAS instructor who has supervised our aerial operations since 2021. That includes survey flights in controlled airspace under IAA permission and coordination with air traffic control. Flights are logged, batteries and firmware tracked, and near-misses reported under a just-culture policy.
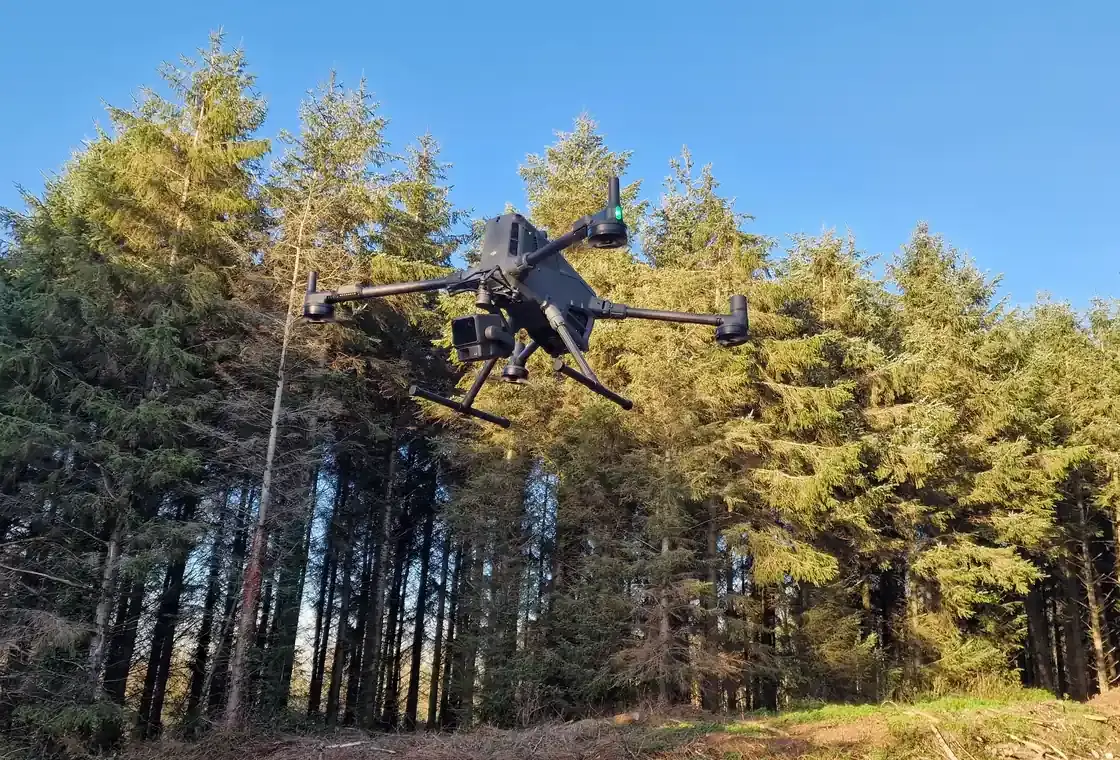
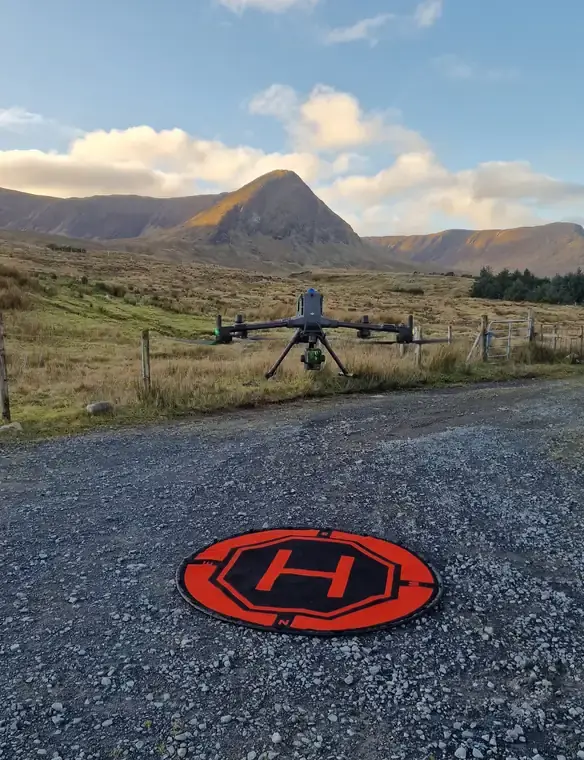
DJI Matrice 400 RTK
Zenmuse L2 LiDAR — up to five returns per pulse, 240 kHz, integrated 20 MP camera — and the Zenmuse P1 45 MP camera. Penetrates the canopy to map the terrain beneath, with the endurance for large surveys.
DJI Mavic 3 Enterprise Multispectral RTK
20 MP RGB and four-band multispectral with RTK: plant health and vegetation indices invisible to the eye, secondary mapping, photography and video.
DJI D-RTK station
Base station and GNSS rover for ground control and independent checkpoints, with network RTK corrections for the aircraft and the rover.
DJI Terra, QGIS and R
Point clouds processed, classified and modelled in DJI Terra on a dedicated workstation; QGIS for mapping and GIS layers; R for tree-level analysis.
From first call to usable data in four steps.
Every survey follows the same four steps, RTK-corrected throughout — network RTK, or our own base station where there is no mobile coverage — with ground control and independent checkpoints measured by survey-grade GNSS. Nearly 300 ha of mountainside with no forest road has been surveyed in a single job, with ground plots measured afterwards to check the data.
Scope
We agree the area, the questions you need answered and the outputs and formats you want.
Fly
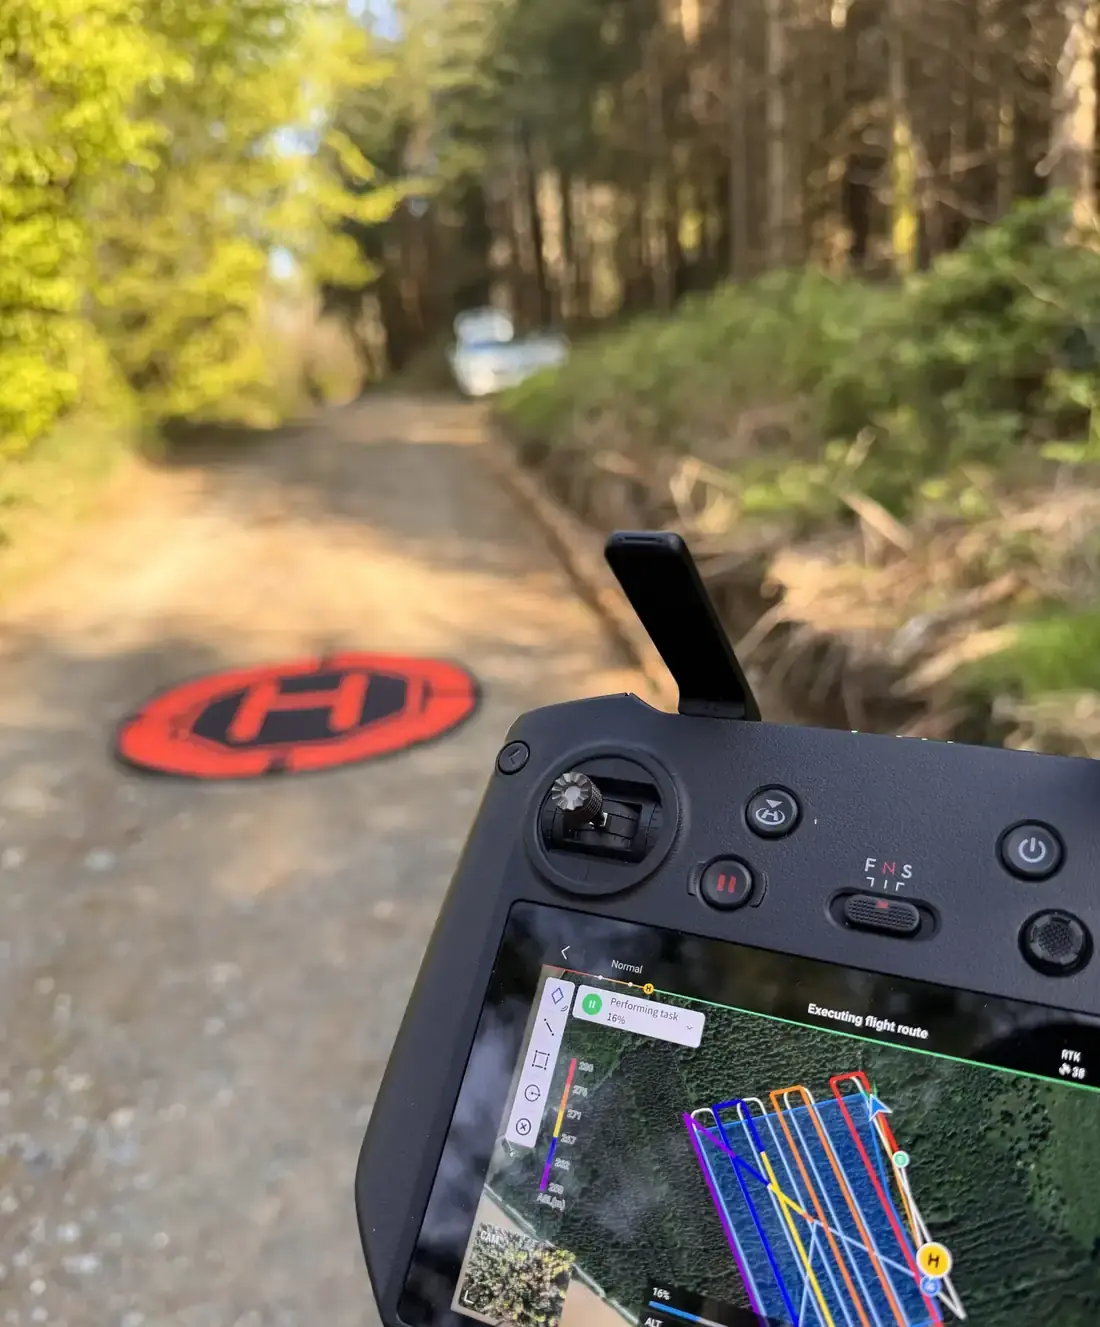
FMI’s own crews fly the site with LiDAR, photographic and multispectral sensors — RTK-corrected throughout, within visual line of sight with a visual observer for every flight block, and checked on the day for coverage, overlap and point returns.
Process
Point clouds are classified and modelled in-house, led by a forester with 13 years’ GIS and remote-sensing experience; ground points, canopy models, individual trees and indices are cross-checked against field plots, and no dataset leaves the office until a second team member has signed it off.
Deliver
Maps, GIS layers and a plain-English managers’ guide — or a control schedule and survey report for engineering projects — with a forester on the phone to talk it through.
Useful at any scale, from a single stand to a portfolio.
Investment funds & utilities
Consistent, repeatable measurement across a whole portfolio — for valuation, inventory audits and management reporting.
For this sectorWind, solar & energy companies
Topographical survey for turbine, track and cable-route design; vegetation heights around turbines and lines; terrain for road design; and the forestry data a felling licence application needs — from one flight.
For this sectorPrivate forest owners & farmers
An honest picture of what is standing — and what is windblown, thinly stocked or unhealthy — before a thinning, a sale or a replanting decision.
For this sectorBefore you pick up the phone.
Is a drone survey accurate enough for design?
Yes, when it is done as a topographical survey. Ground control and at least 20% independent checkpoints are measured by survey-grade GNSS, everything is delivered in ITM with heights to Malin Head datum, and the achieved accuracy is tested against the withheld checkpoints and reported at 95% confidence — with the control schedule and survey report to show it.
Can you fly in winter?
Yes. LiDAR is unaffected by leaf-off, and we fly under the cloud base from the forest road network — no airfield, and no waiting for a clear day across a whole county.
Who owns the data?
You do. Every dataset is delivered in open formats, and we hold a secure archive copy for six years unless you ask us to delete it.
Thinking about a survey?
Send us the location and rough area. A forester replies within one working day. The first call is free.